Trading with the Marubozu candlestick pattern
Take any chart on any given day and you will be able to spot the Marubozu candlestick pattern in one of its shapes.
In the chart below, we have the USD/CAD chart, where you can see the bullish Marubozu open candlestick.
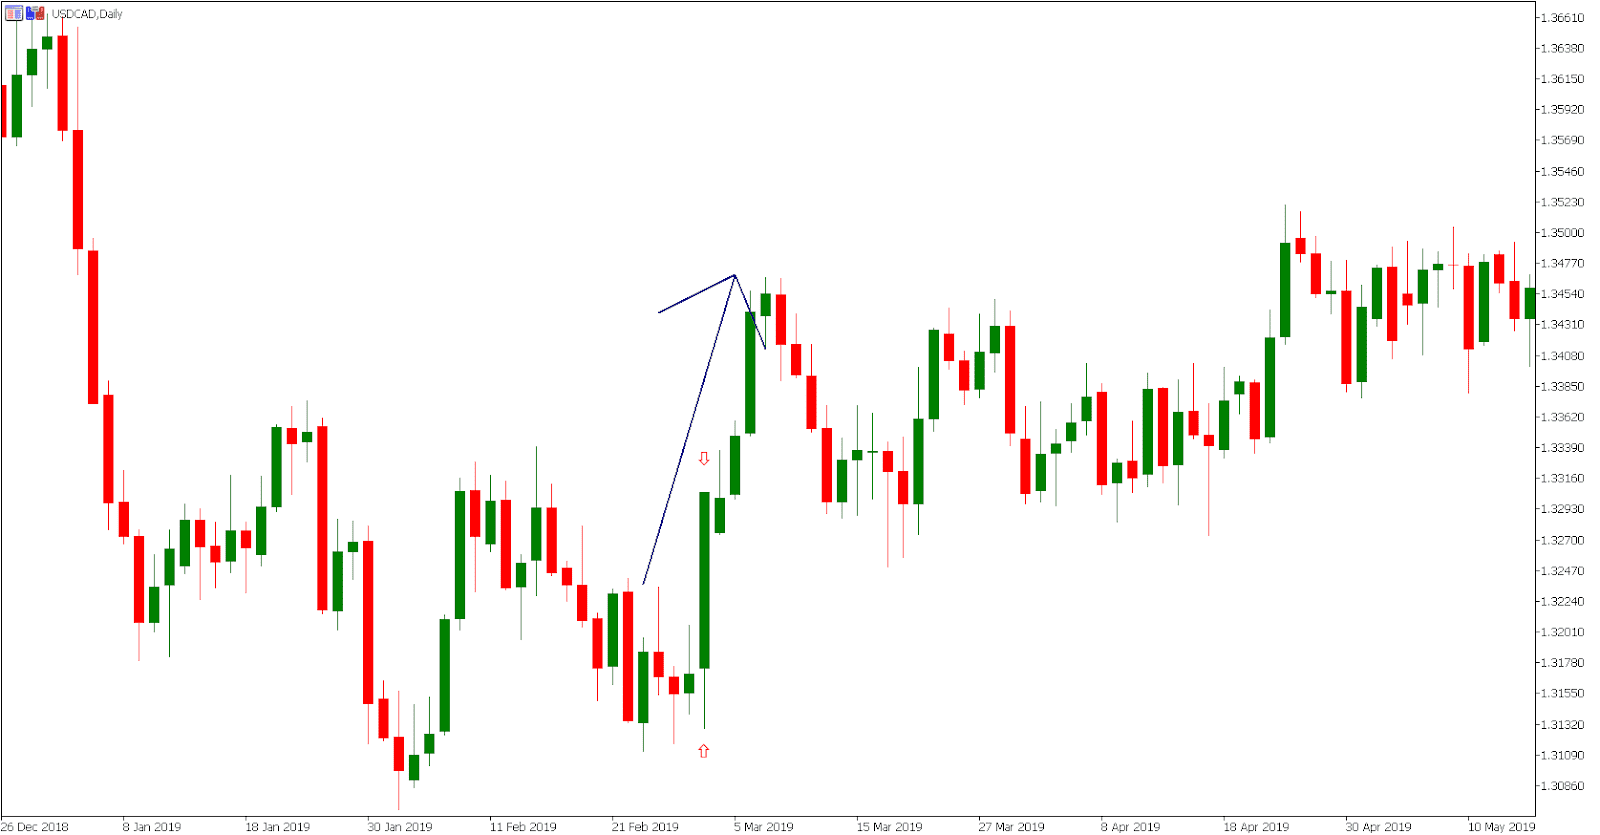
After a downtrend, the price action consolidates by trading sideways. At one point, the bulls take charge by pushing the price action higher, finally creating a candle where the open and low are at the same price, but the close and high are far upfront.
The market is telling us that the trend is now bullish as the buyers controlled the price action from the open to the session’s end. The trend has then continued higher to ultimately create the new short-term high.
Trading Marubozu, in the context of entry,
take profit, and stop loss, is more difficult than, for instance, trading the hammer. This pattern usually produces strong one-sided candles that are easy to spot and interpret, but the trading elements are not as clear.
A hammer pattern gives you a clean low, which is used to determine the stop loss, while Marubozu is more dependent on the other technical indicators.
In this particular case, you can enter a long trade after the bullish Marubozu open is created, as it signals that the trend is likely to continue, but you should use other tools and indicators to determine profit-taking and stop-loss orders.
This example shows us how the Marubozu candlestick pattern works. It generates a signal that the market sentiment is quite one-sided currently as, in this case, the bulls took the price action higher without much resistance from the bears.
In the second example, we have the opposite situation. The price action has reversed its course and it now trades in a bearish environment. After two long red candles, the bearish Marubozu close pattern occurs, which signals that the bears are still a dominant force.
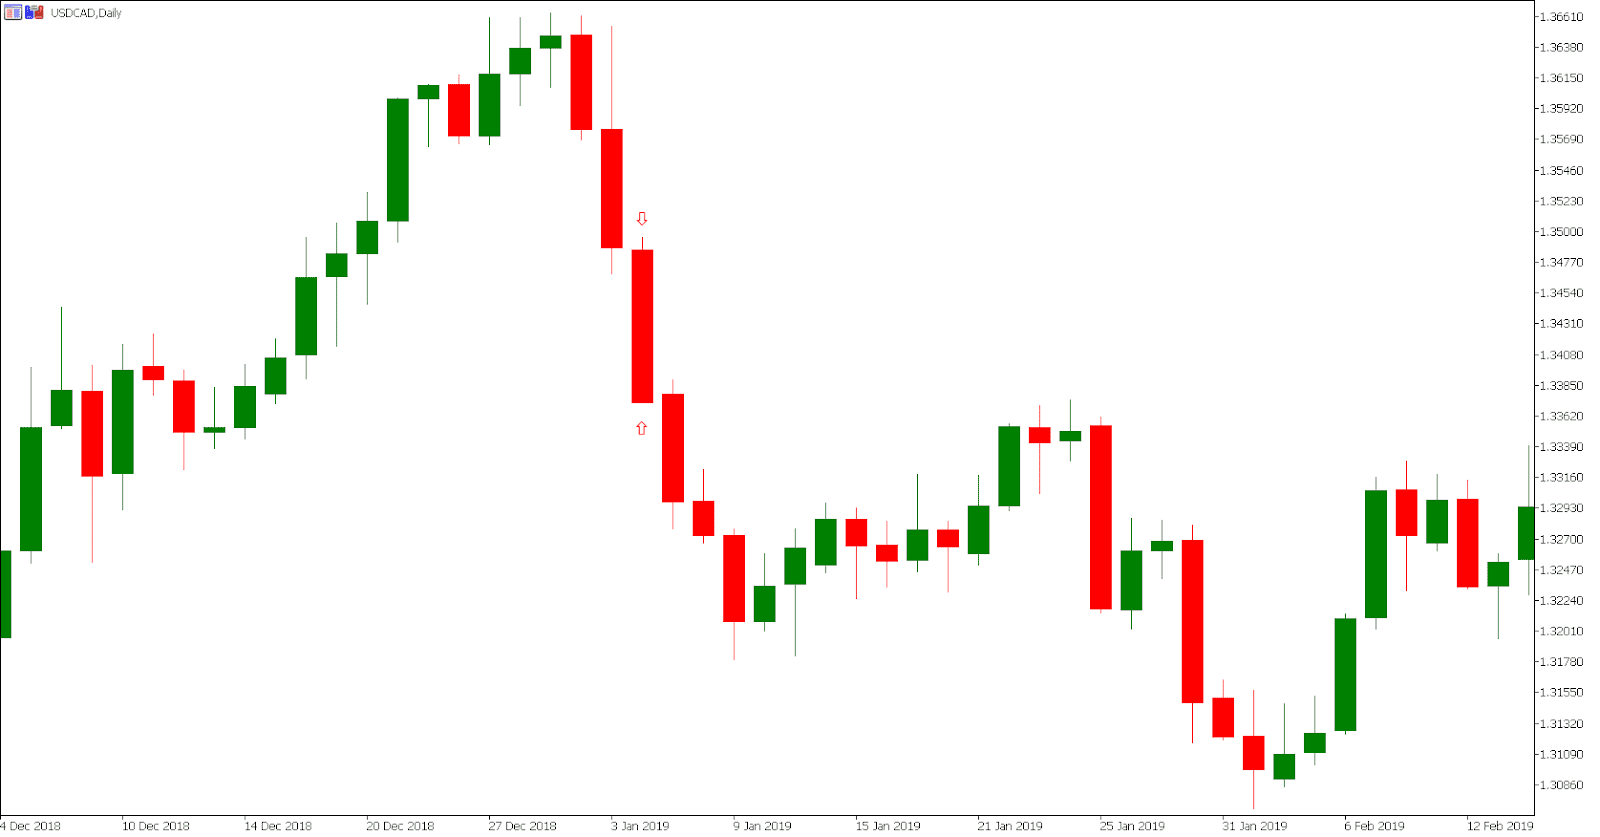
Ultimately, the price action continues to move lower as the market was very bearish during this period of time. The importance of the bearish Marubozu close candle is that it signaled to us that the dominant trend is set to continue as the bulls are unable to change the trend direction.
It is important to note that in both occasions, Marubozu candles only generated a signal about the future price action outlook. Unlike the reversal patterns that are more powerful with the signals or warnings that they generate, Marubozu is usually used only to confirm that the price action may continue in the same trend.
For instance, if you are short USD/CAD from the reversal point, an occurance of the bearish Marubozu close tells you to stay in a trade as the bears are still in control.